Field guide · 05
Measure the system. Do not read it.
One client had 3,621 repositories in its organisation. Another had 160 packages in one monorepo and 1,177 distinct colour values across them. Nobody reads that. An audit at that size is a set of measurements, a conversation with the people who live in the numbers, and a verdict you can run again next month to see if it moved.
00
The question is not whether it is tidy
Most design system reviews ask whether the library looks consistent. That is the wrong question at scale, because a library can be internally consistent and still unused. The question that matters is where the system actually reaches: how many files import the token package, how many teams rebuilt the button, how many products are still on the old stack.
Those are counts, and counts come from scripts, not from opening files one at a time. The whole method below is a way of getting to a small number of counts that mean something, and then arguing from them.
01
Talk to people before reading the files
The files tell you what exists. People tell you why. Before I open a Figma library or clone a repo, I talk to designers, engineers and product managers about how work moves between them. Where do they stop trusting the system? What do they rebuild every time?
On almost every audit, the biggest problem was not in the files. It was a handoff that relied on screenshots, or a team that quietly kept its own copy of the components. A script will find the copy. Only a person will tell you it exists because the contribution process takes six weeks.
The interviews also set the scope. One product team told me multi-brand theming was not a requirement for them. That one sentence removed a whole category of findings from their half of the audit, and it would never have come out of the code.
02
Audit the bindings, not the pixels
On one rebuild, an audit flagged a gold accent, a 72px headline and two line heights as missing tokens. All four already existed. The gold was a brand token, the 72px size was the top of the type scale, and the line heights were a choice in the demo, not a gap in the system. The audit had compared rendered pixels to the token list. When I compared the design’s actual bindings instead, the gaps disappeared.
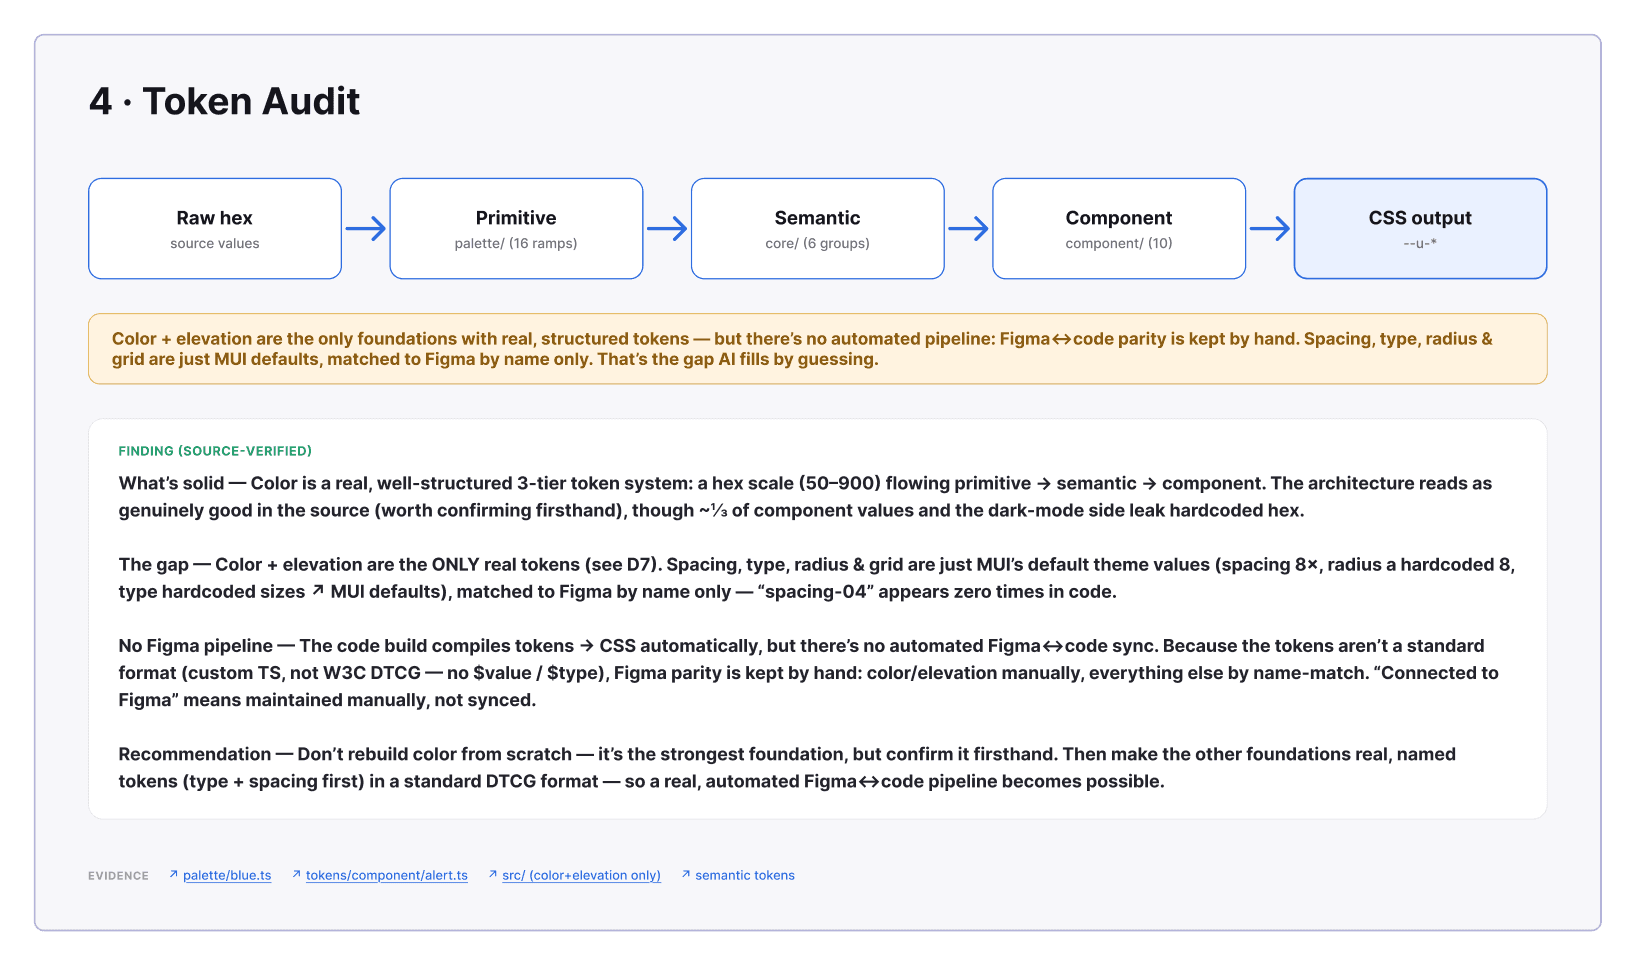
So the first measurement is always what counts as a token at all. In the figure below, colour and elevation were the only two of ten foundations with real, structured tokens. Spacing, type, radius and grid were the framework’s defaults, matched to Figma by name only. That is the gap an AI tool fills by guessing.
03
What the distribution tells you
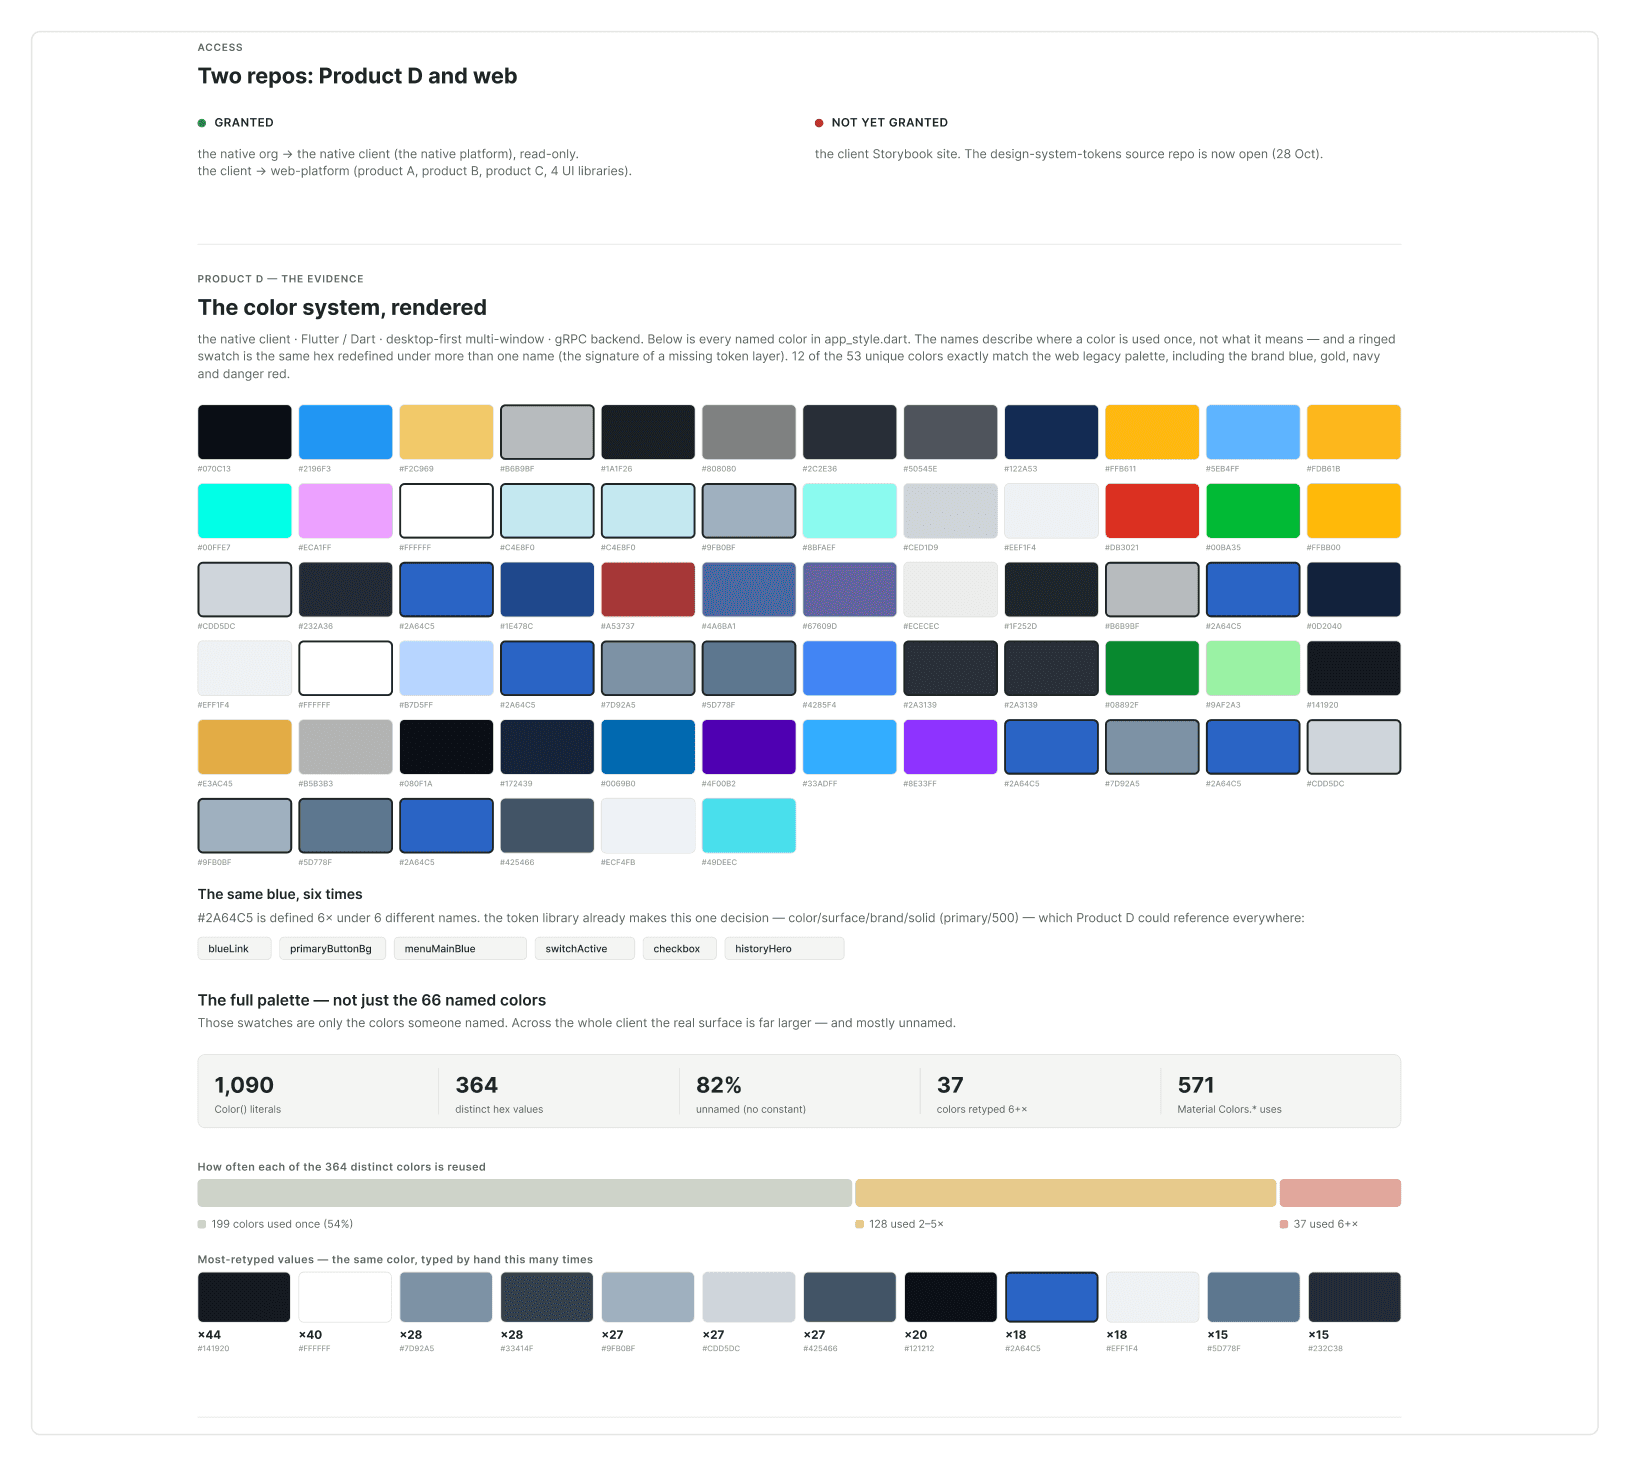
A count on its own is a headline. A distribution is a diagnosis. The native desktop client below had 1,090 raw colour literals and 364 distinct values. The useful number is the third one: 199 of those values, 54 percent, were used exactly once. That is not a palette with drift. That is the absence of a palette, and the fix is a token layer, not a cleanup.
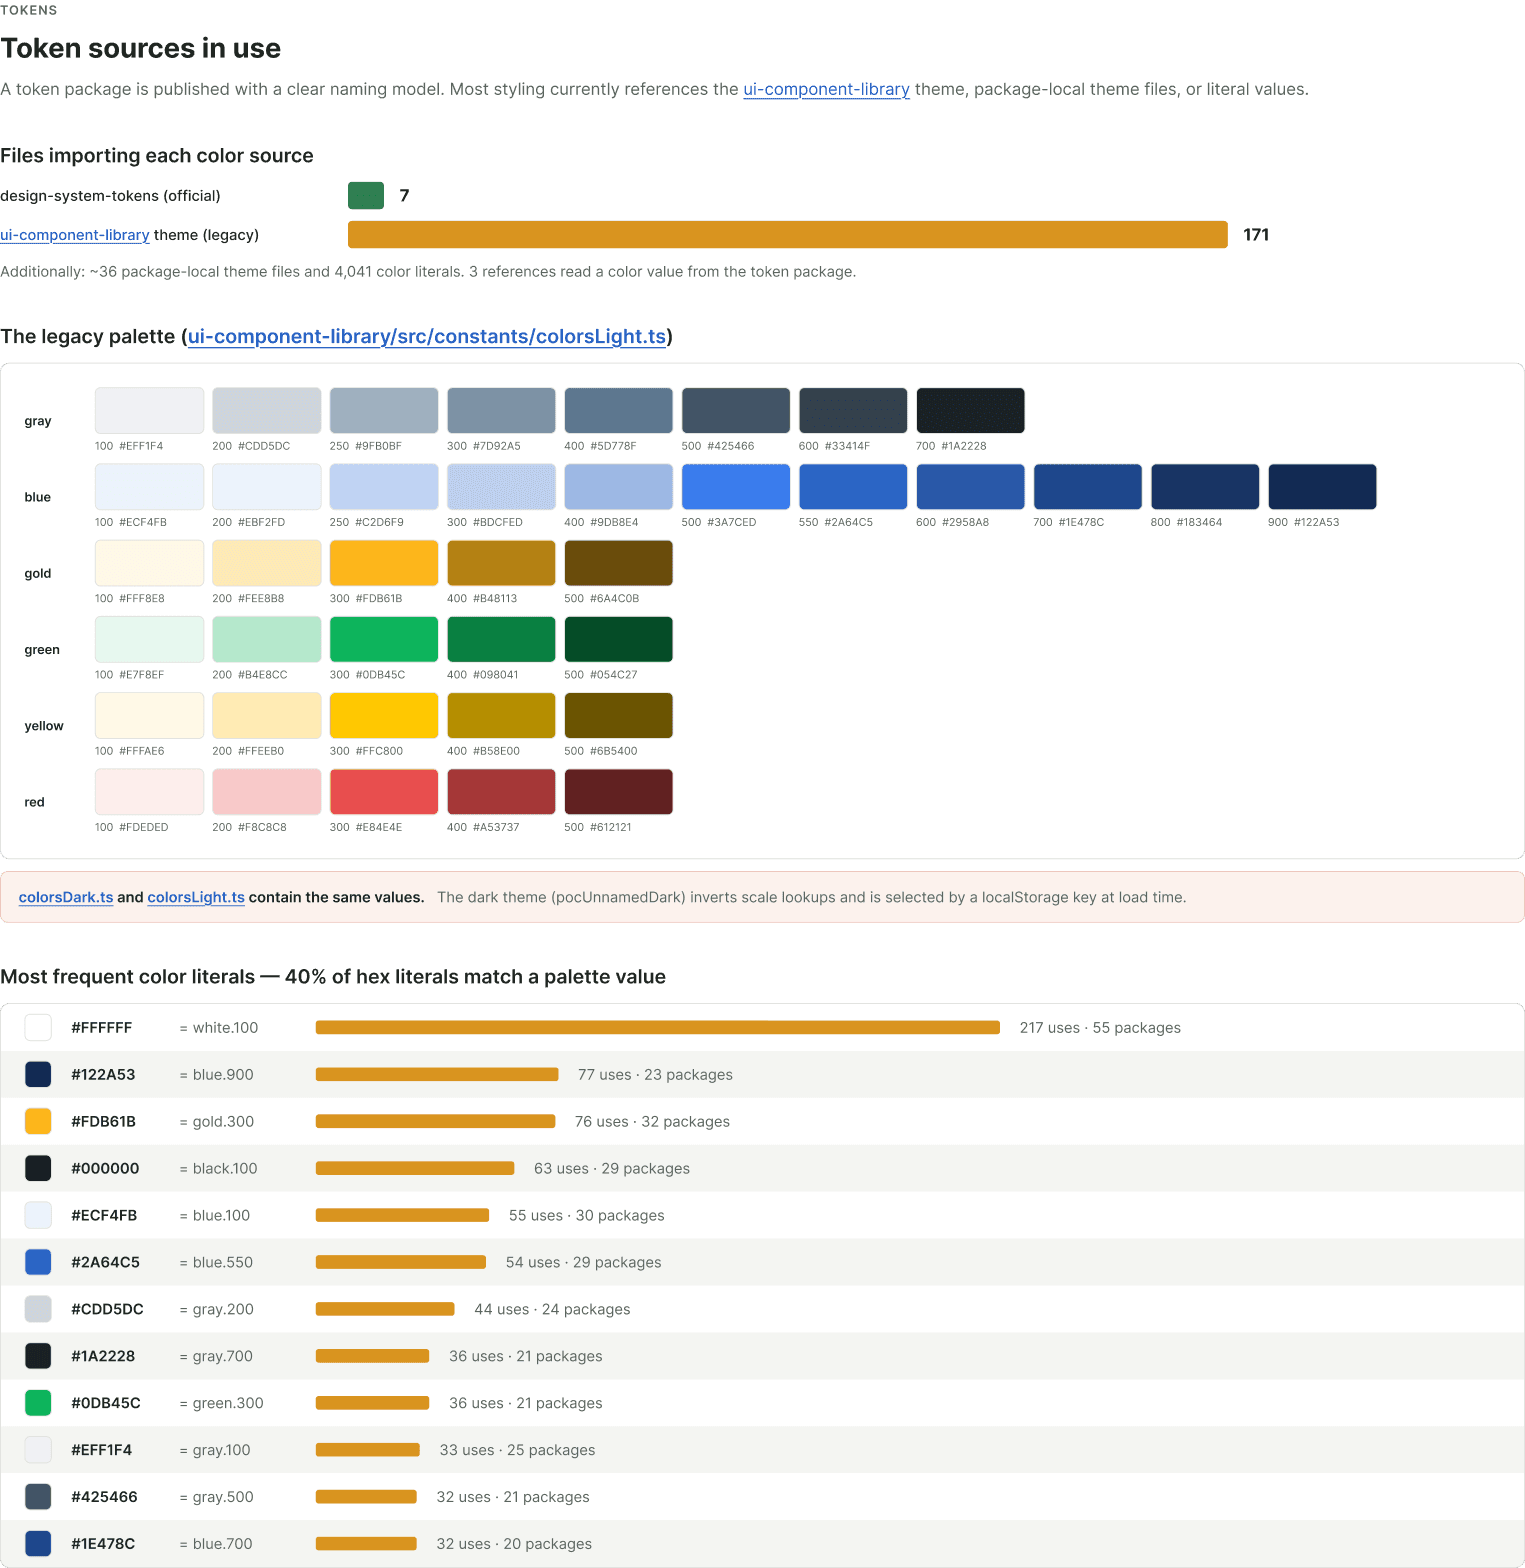
Adoption is the same kind of number. Seven files imported the official token package; 171 still imported the legacy theme. Both existed, both were documented, and the ratio told the team which one their platform actually ran on.
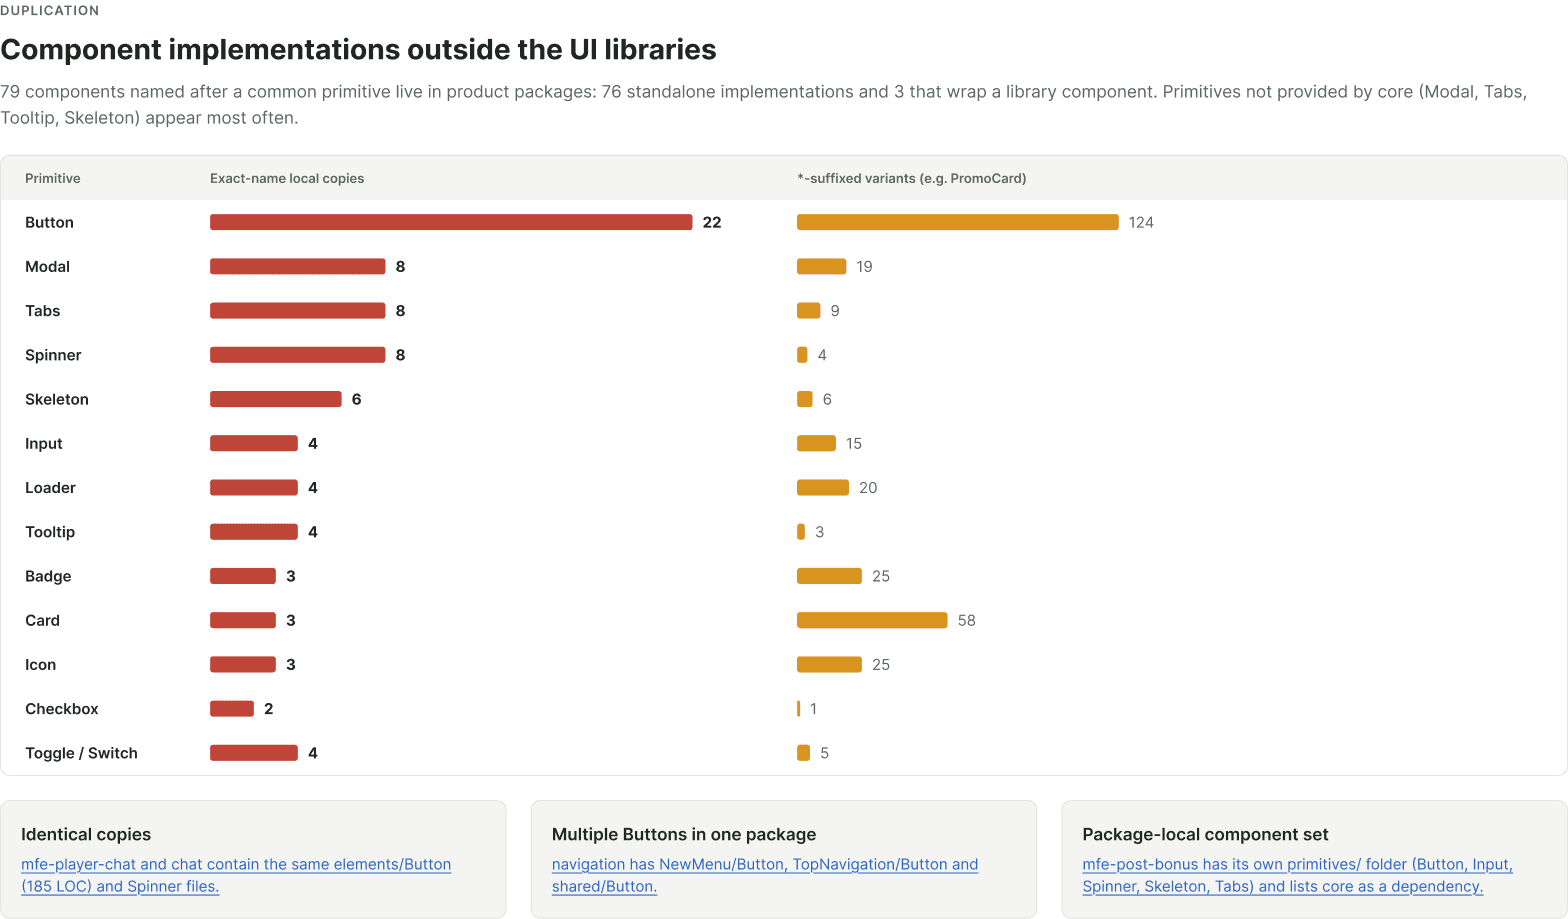
Duplication is the third. Seventy-nine components named after a common primitive lived in product packages rather than in a library, and Button alone had 22 exact-name copies. The chart is the backlog: the components teams keep rebuilding are the ones the system should absorb first.
04
Good, bad, ugly, and unknown
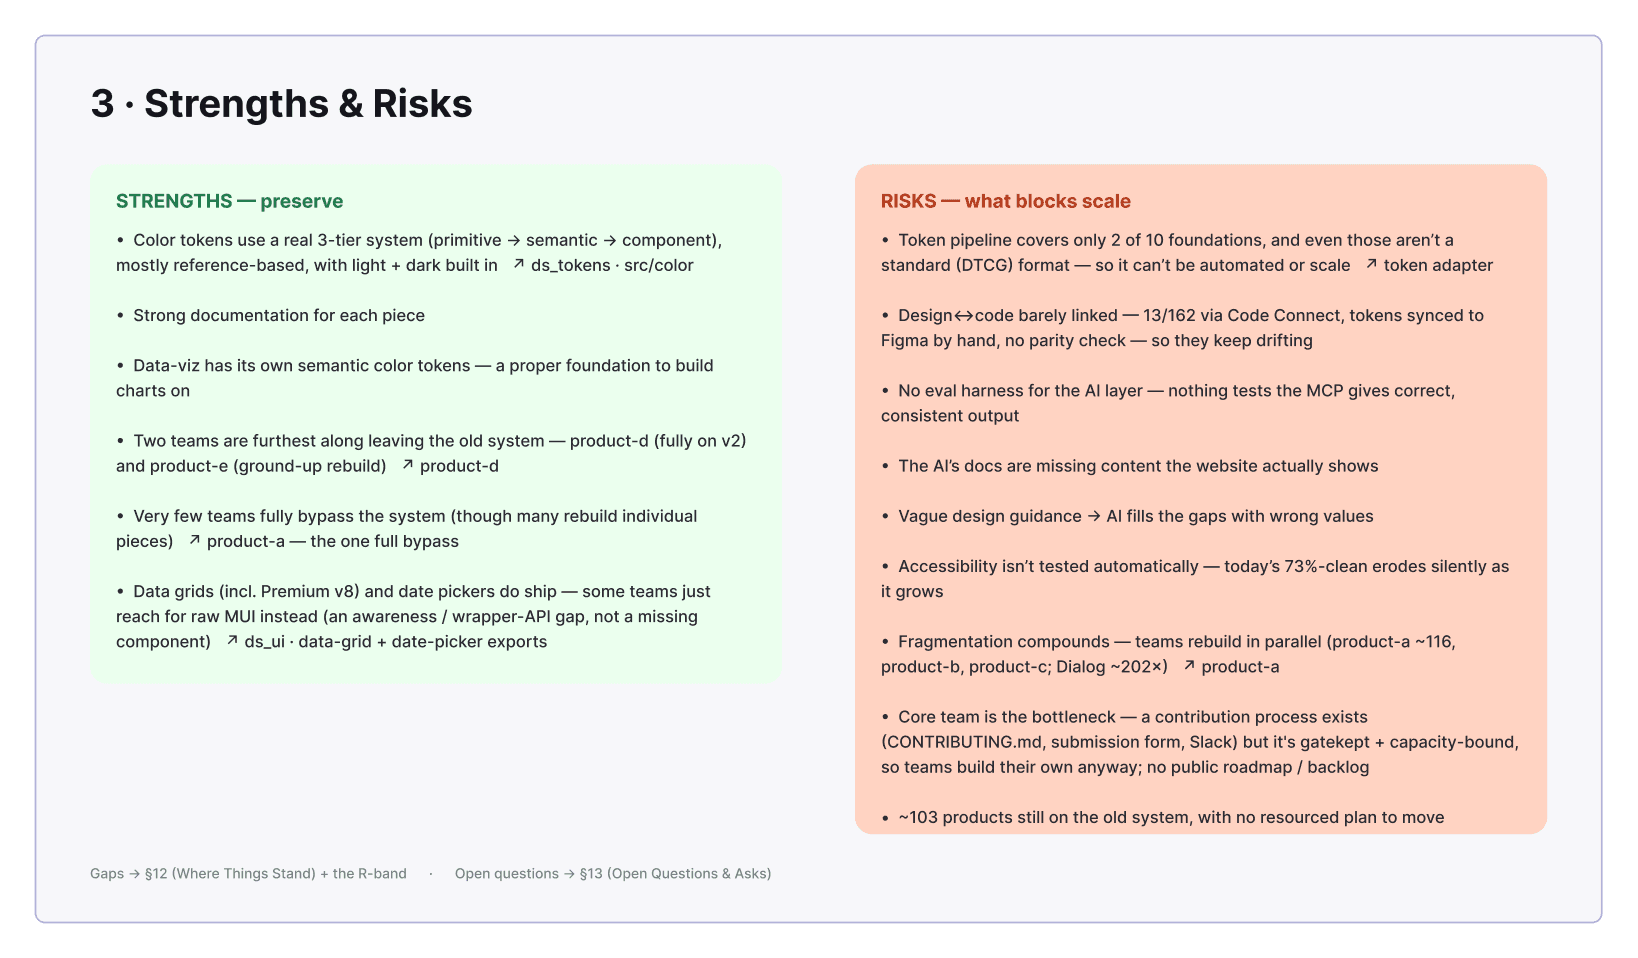
Every finding goes in one of four buckets. The good is what to keep: tokens that exist, a library designers already use, a release pipeline that works. The bad is what costs time: mixed naming, components with no code match, handoff by screenshot. The ugly is what blocks scale: hardcoded values, detached components, no owner, no changelog.
The fourth bucket matters most and most audits skip it. Unknowns are the questions that have to be answered before anyone commits to a roadmap. Who approves a new token? Does the code already have its own parallel system? Which brands need their own look? A roadmap built without that list is built on guesses, and it will stall at the first one that turns out wrong.
05
Two rules for what to do with a value
Once the counts are in, the recommendations tend to come down to two decisions, made over and over.
A token has to earn its place. The value has to come up more than once, and it has to fit the scale that is already there. A 20px corner radius used on one marketing card fails both tests. It goes in the CSS as a plain value with a comment saying why. That feels wrong to people who want everything tokenised, but a scale that absorbs every one-off stops being a scale, and then nobody can predict what the next value should be. Neither can an AI tool.
Same value, different meaning: keep both. Two tokens both resolve to white. A page background and the text on a dark button can share a value today and split apart next quarter when the brand changes. Same value and same meaning, merge. Same value and different meaning, keep both. Merging by value is how a dark mode breaks.
06
Score it so leadership can read it
A list of findings is for the team. A scorecard is for the people who fund the work. Each category gets a number from 0 to 3: missing, inconsistent, mostly structured, governed and machine-readable. One line of evidence per row, so the number can be argued with.
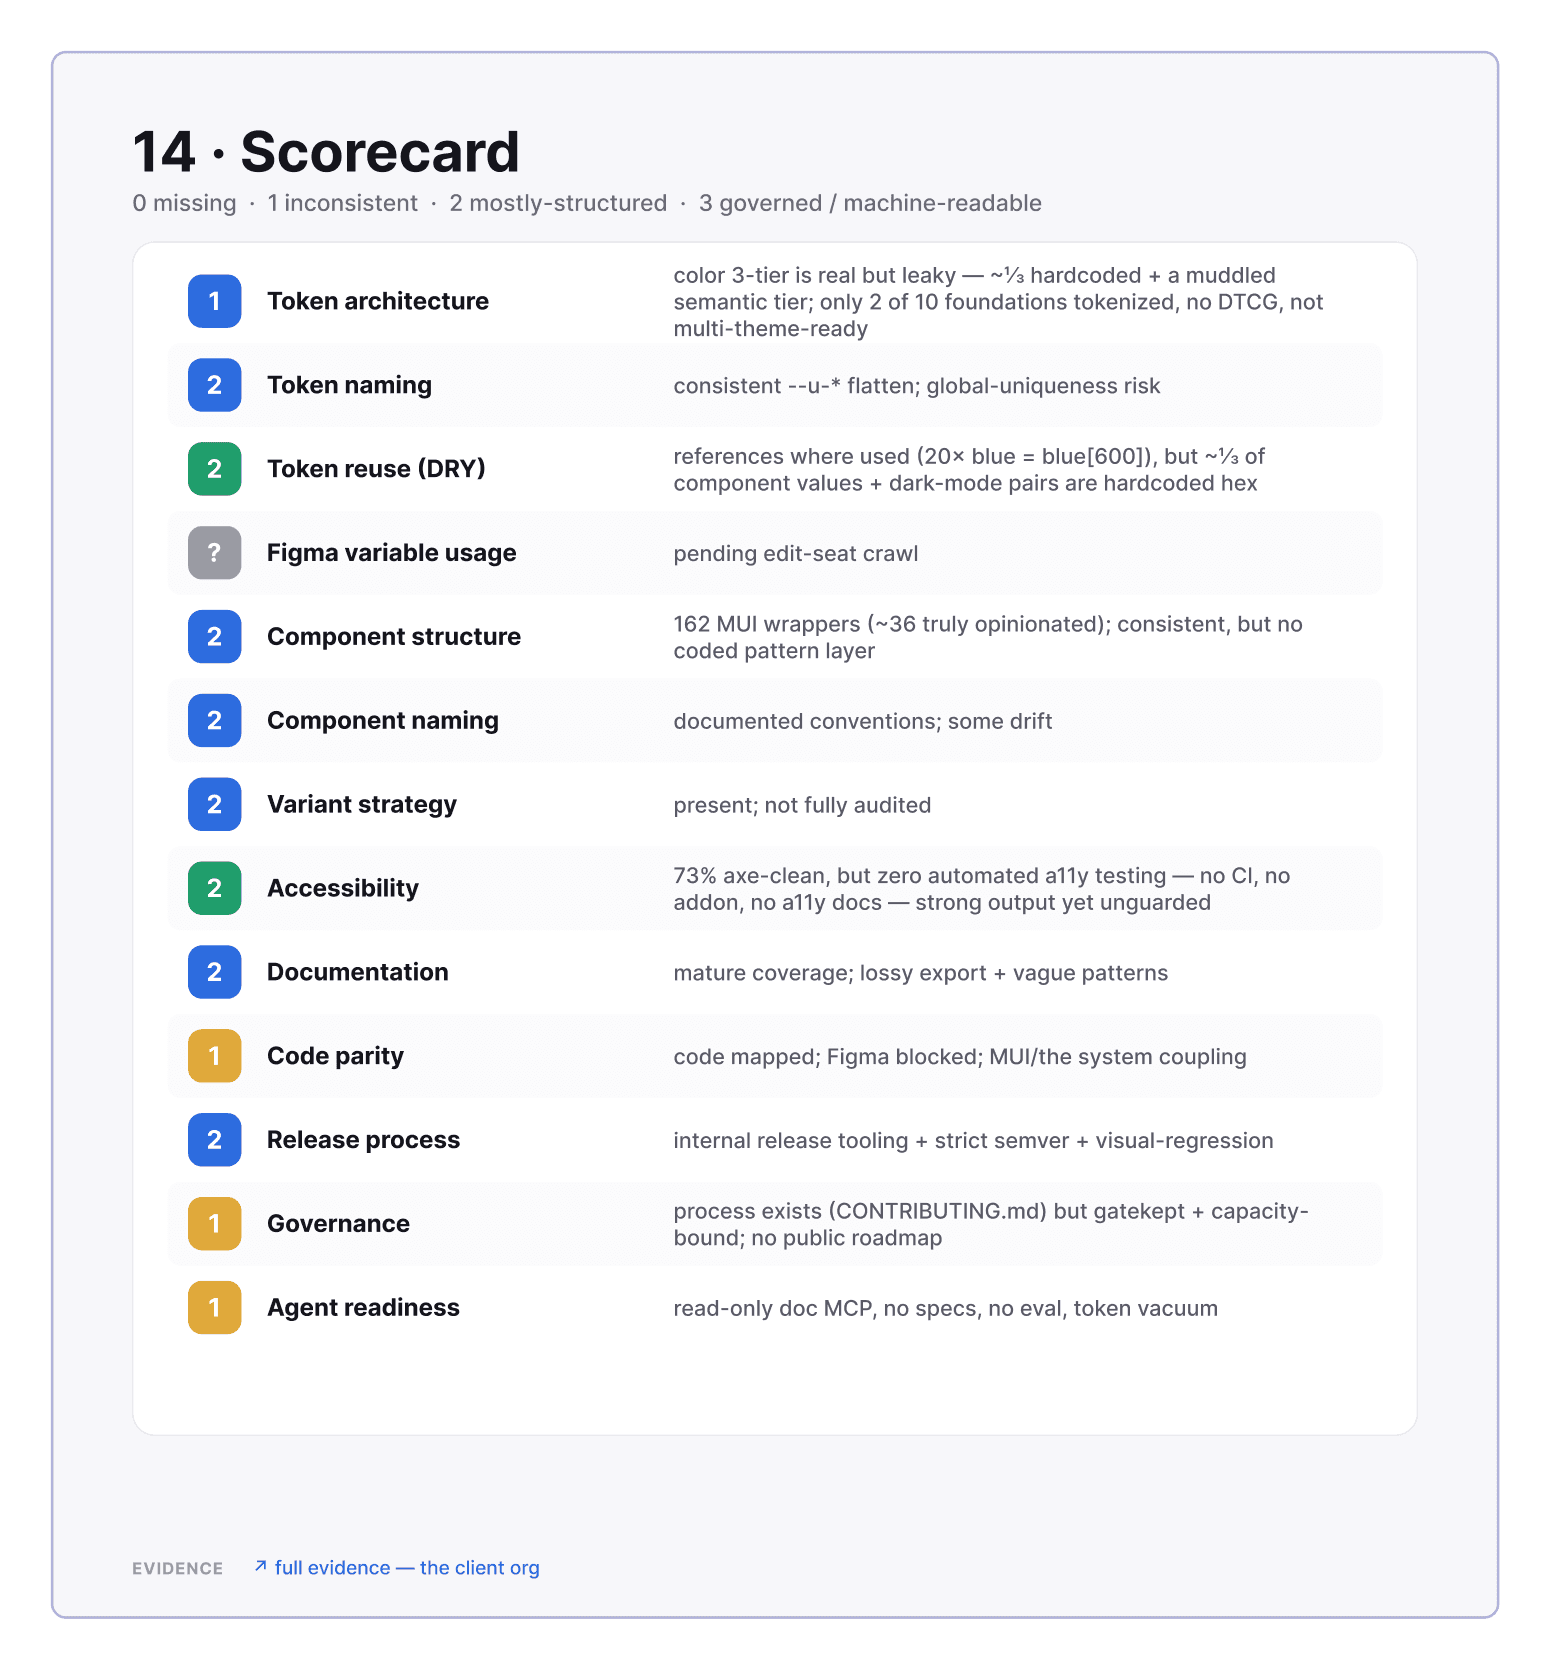
The last row is the one I added in 2026. Agent readiness asks whether an AI tool can use the system without guessing: are the token names readable, does every component have a spec, can a tool look them up? It is the same question as “can a new hire use this,” asked of a reader with zero context. A system that passes for an AI tool usually got easier for people too.
The consulting version of this scale, eight pillars scored one to five, is on the methodology page. Same idea, fewer rows, tuned for a one-week engagement.
07
Then run it again
A token audit that says “312 problems” does not help anyone, so the violations get graded. Critical: a hardcoded colour. High: a raw palette token used where a purpose token should be. Medium: a raw pixel size. On one redesign, ten CSS files had 175 violations and two files held 100 of them. That tells you where to start.
Then the same script runs a week later. 184 became 175, and one refactored file accounted for most of the drop. The count going down is the progress report. Nobody has to write one.
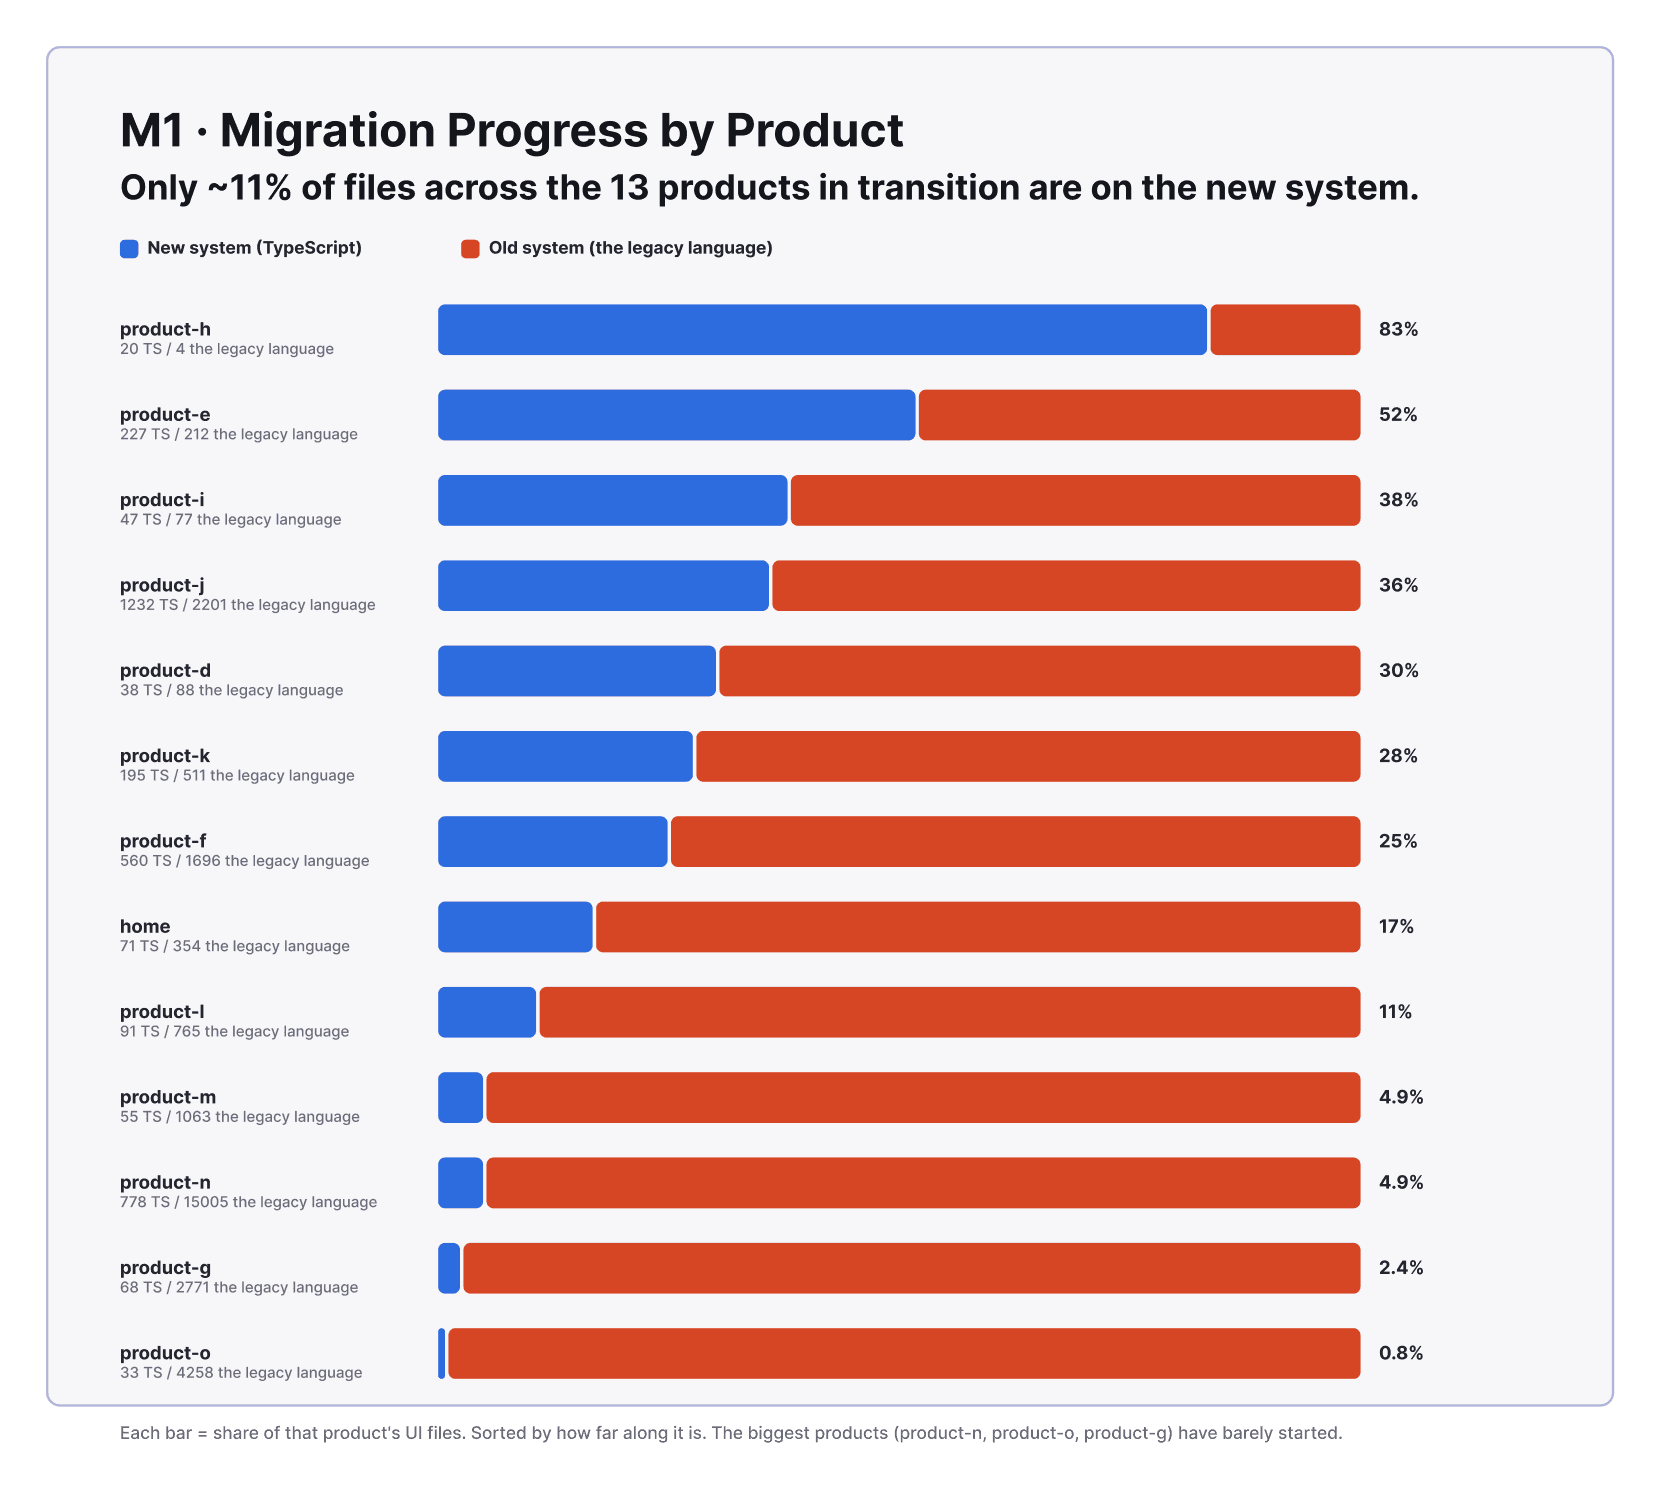
This is also why the measurements have to be scripts and not judgement. A finding you cannot re-run is an opinion. A finding you can re-run is a metric, and a metric is something a team can be asked to move.
08
The test
For every finding, ask: could someone else run this and get the same number?
If yes, it belongs in the audit, and the next run will tell you whether the fix worked. If no, it belongs in the interview notes, where it is still useful, but as context rather than as a claim.
The audits above ran that way: a crawl of every consumer repository, a read of every Figma library in Dev Mode, an accessibility pass over every Storybook story, and a day of conversations before any of it. The method is written up in the audit playbook and the figures came off the boards those audits were delivered on. Client, product and people names were swapped for generic ones before capture.